Oral Presentation Australian Diabetes Society and the Australian Diabetes Educators Association Annual Scientific Meeting 2014
Estimating Glomerular Filtration Rate: the Performance of the CKD-EPI Equation over time in Patients with Type 2 Diabetes. (#170)
Background: Serumcreatinine based equations are routinely used to assess renal function. Recentlythevalidity of these equations in diabetes has come under scrutiny.
Aim:
To determine the performance of the Chronic Kidney Disease Epidemiology Collaboration (CKD-EPI) equation to estimate glomerular filtration rate (eGFR) over time in adults with type 2 diabetes.
Methods:
Adults (n=152) with type 2 diabetes attending Austin Health, Melbourne, with ≥ 3 prospectively measured GFR (mGFR) values over ≥8 year follow up period were included. Plasma disappearance of DTPA (diethylene-triamine-penta-acetic acid) was used to calculate mGFR and compared to eGFR. The agreement between mGFR-eGFR was estimated using Intraclass Correlation Coefficient and reduced major axis regression. The association between variables was investigated using random effect linear regression.
Results:
152 patients had a median of 4 (IQR: 3, 5) mGFR measurements over a follow up period of 11 years (IQR: 9, 12). Median baseline mGFR was 95ml/min/1.73m2 (IQR: 77,109) and median baseline CKD-EPI eGFR was 83 ml/min/1.73m2 (IQR: 72, 95). Adjusted for mGFR and age at baseline, the average within-participant decline per year was 2.6ml/min/1.73m2for mGFR (p<0.001) and 1.6ml/min/1.75m2 for eGFR (p<0.001).
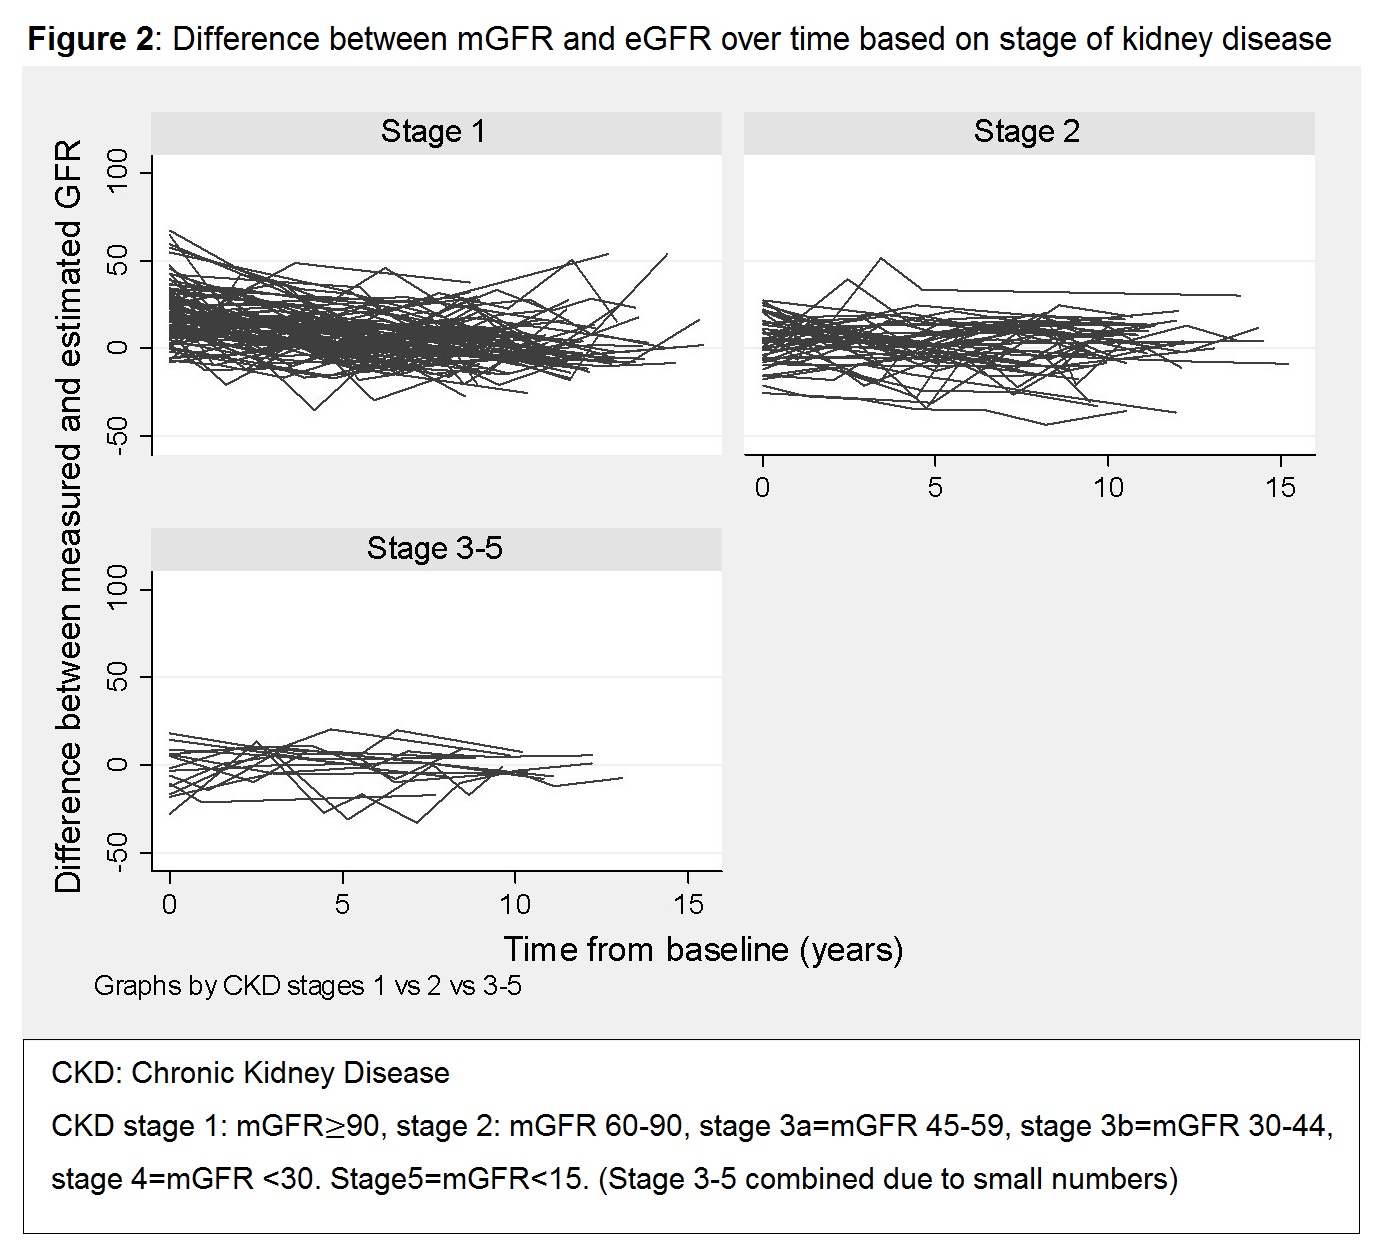
Despite substantial overall agreement between mGFR and eGFR (ICC=0.65), the magnitude of mGFR-eGFR difference increased by 0.2ml/min/1.75m2 per every 1ml/min/1.75m2 increase in mGFR, with the highest agreement achieved at an mGFR of 60ml/min/1.75m2 (Figure 1). No statistically significant associations between the mGFR-eGFR difference and Body Mass Index, body surface area age or time from baseline were detected. As earlier stages of CKD are associated with higher mGFR values, the baseline eGFR underestimated mGFR by an average of 10ml/min/1.75m2, and the mGFR-eGFR difference decreased by 0.78ml/min/1.75m2 per year (p<0.001) (Figure 2).
Conclusions:
The current findings raise concerns regarding the use of the CKD- EPI formula to monitor renal function in patients with type 2 diabetes without overt nephropathy.